Retrospective tutorial
Monitoring containers from Docker and Kubernetes
Objectives
-
Monitor containers from Docker and Kubernetes
-
Get to know the container browser
-
Use profiles in your monitoring process
Before we begin
The precondition for monitoring are some running containers that all write steady logging information. In this tutorial there will be three containers named whale, dolphin, squid and lobster.
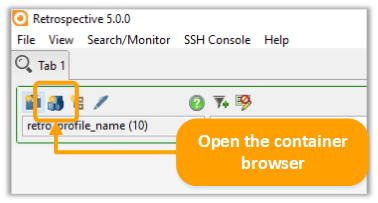
Step 1
Press the container icon located top left on your search tab and you'll be presented a dialog that lets you choose the containers to be monitored.
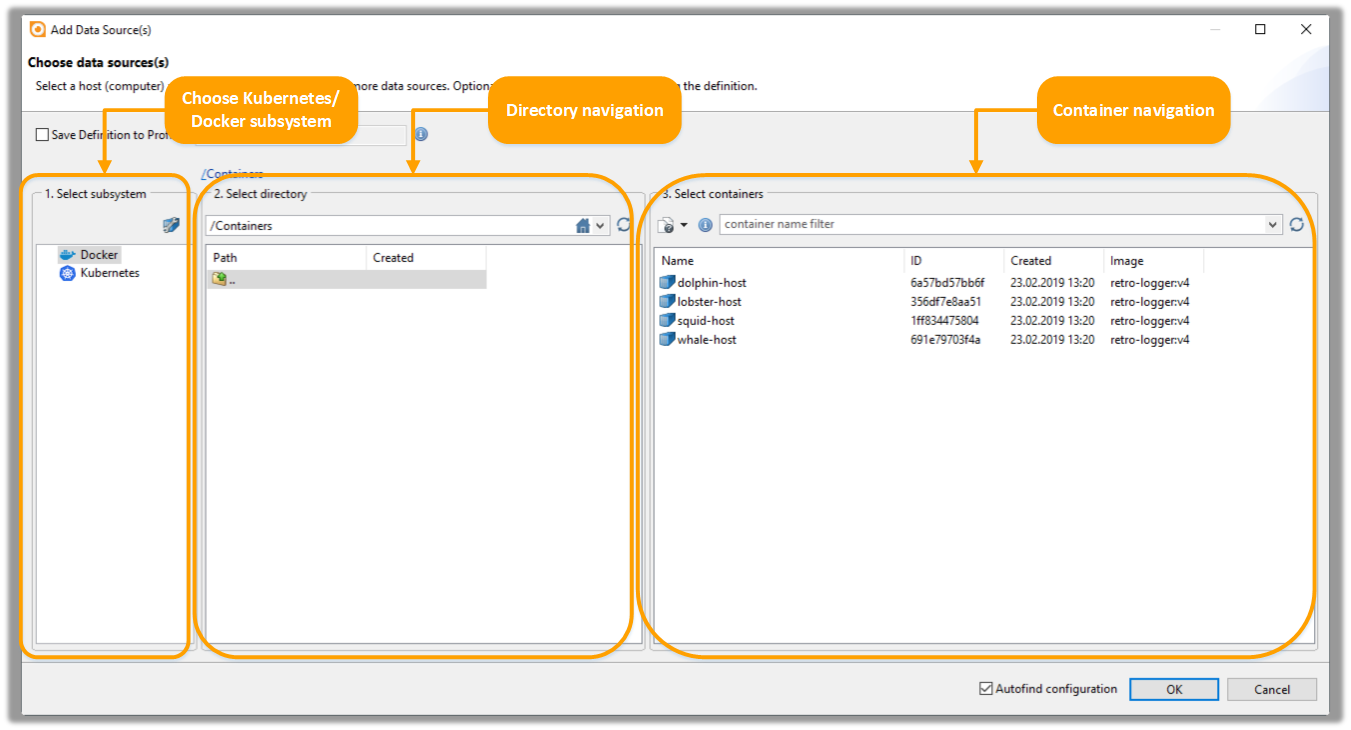
Step 2
You narrow down your selection from left to right by picking a subsystem, a directory and finally a number of containers. You may switch between two selection modes that let you either select containers individually or define a filter pattern that will include matching containers.
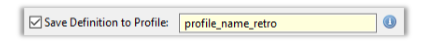
Note: Here you have the option to save your definition to a profile. To do that, simply check the box and name your profile. This profile will appear from now on in the pProfiles Manager tab among your other profiles.
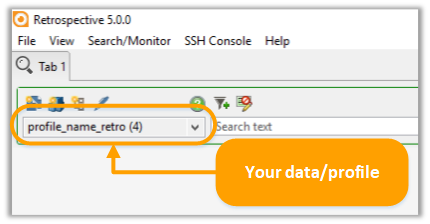
Step 3.1
In the dropdown-menu in the upper left corner, you can now see your data (or your profile if you chose this option beforehand).
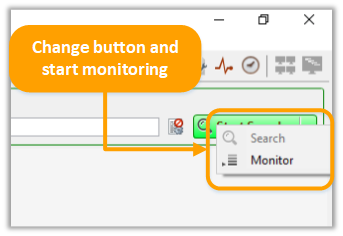
Step 3.2
Over the little arrow head, you can change the search button to a monitor button. By the pressing this one, you start monitoring the data you have just chosen.
Annotation
An alternate way to monitor a collection of data is by creating a profile in the profile tab. The same way as described above, Retrospective allows you to select sources from Docker and Kubernetes. Besides that, you can also combine container-based and file-based data.