06. Sep. 2019 by Helen
Retrospective Release 5.3.0 goes for advanced data visualization and analysis
Retrospective is a powerhouse when it comes to instant collection and structuring of log data from local and remote computers. For a long time we have been thinking about how we can better process and present this data for analysis purposes, that would be of additional value to our customers. Unfortunately, various attempts to offer such functionality within Retrospective did not lead to the desired results and were dropped again.

Finally, we have chosen an approach that is completely decoupled from Retrospective; we have developed the Online Graph Maker Koia that runs in the browser and retrieves the data from a CouchDB database fed by Retrospective. Although Koia was written for Retrospective, it is a completely self-contained product that can be used for other purposes as well. The great thing about this tool is that the complete program code is freely available to anyone on GitHub under the terms of the MIT license.
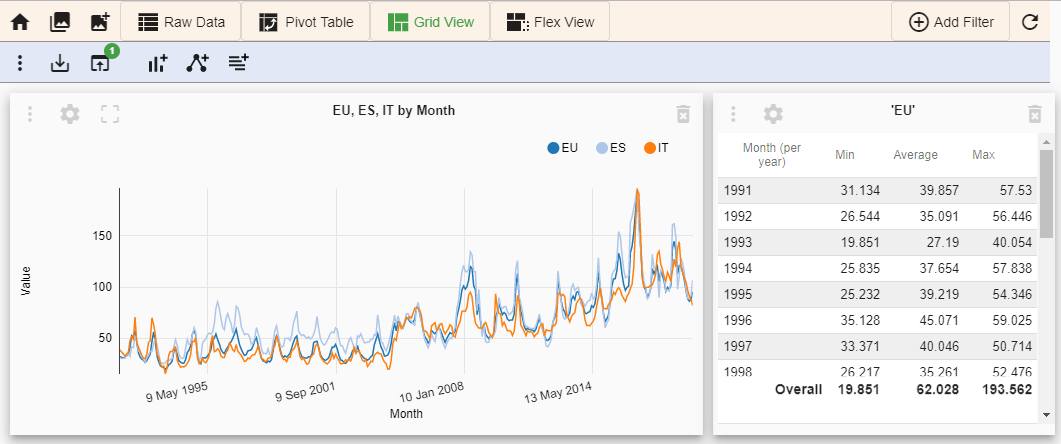
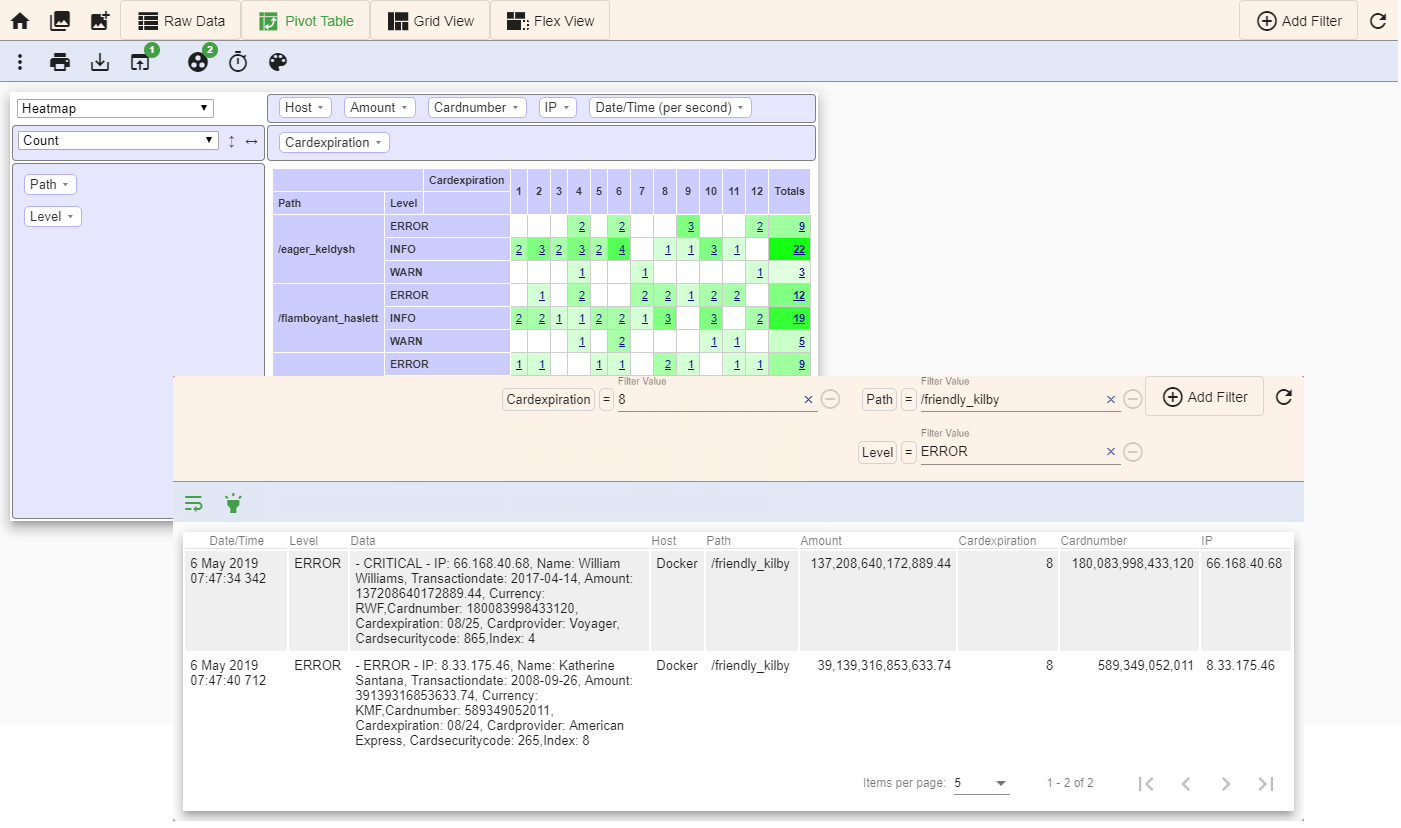
In Koia, data is filtered, grouped and compiled by the user to be displayed in desired form using pivot tables, summaries, graphs and charts. The reference to the original data is never lost. Through a simple mouse click on a table cell, a graph or a chart element, entire underlying log data is shown. You won't find such a feature in any other comparable tool!
What else?
Another useful feature in this release allows registered users to export the data of individual result tables to JSON files. JSON (JavaScript Object Notation) is formatted and self-describing text for storing, processing and interchanging data.
Although not one of our preferred tasks, we have also fixed several bugs and made small improvements to existing functions (more about this in the release notes).