17. Dec. 2019 by Urs
Retrospective Release 5.4.0 is focused on security
Like last year, we’re releasing a new version of our Retrospective Log Analyzer at the end of the year.
This release was brought forward by a few days, because one of our customers was not able to register the program on a Windows Server 2019 (AWS EC2 virtual machine). Besides this problem, some annoying bugs have been fixed.
Retrospective version 5.4.0 also contains the following new features:
-
Support for Elliptic Curve Digital Signature Algorithm (ECDSA) in the SSH Transport Layer.
-
Export of result data to CouchDB through HTTPS (CouchDB is used as a data source by Koia.io).
Without going into detail, I can't tell you a rich story about this release. So I'll take this opportunity to show you some of the benefits of Koia.io, which since release 5.3.0 can be used for advanced visualization and analysis of collected and structured data using Retrospective.
Koia.io
Data from individual result tables is usually exported to a locally installed instance of CouchDB so that it becomes available in Koia.io. In order for Koia.io to develop its full capabilities, the Retrospective result data should be refined as far as possible in advance. This includes:
-
Defining custom columns.
-
Filtering relevant data.
-
Defining accurate highlighting.
After exporting the data, Koia.io automatically opens in the browser and displays the raw data. You can now switch between the different views explained below and get the essence out of your data.
Raw Data Table
Displays the data in a table in raw format, the same as was exported from Retrospective. The table offers the following:
Pivot Table
This is a powerful tool to compute, summarize, and analyze data, with revealing patterns and trends.
-
Offers many different views (e.g. heatmaps and table barcharts).
-
Shapeable through drag and drop of individual columns.
-
Totals of rows and columns (hideable).
-
Raw data dialog displays contextual data upon click on individual table cell.
-
Storing current view and restoring it at any time later.
-
Saving of shaped data to files in Excel format.
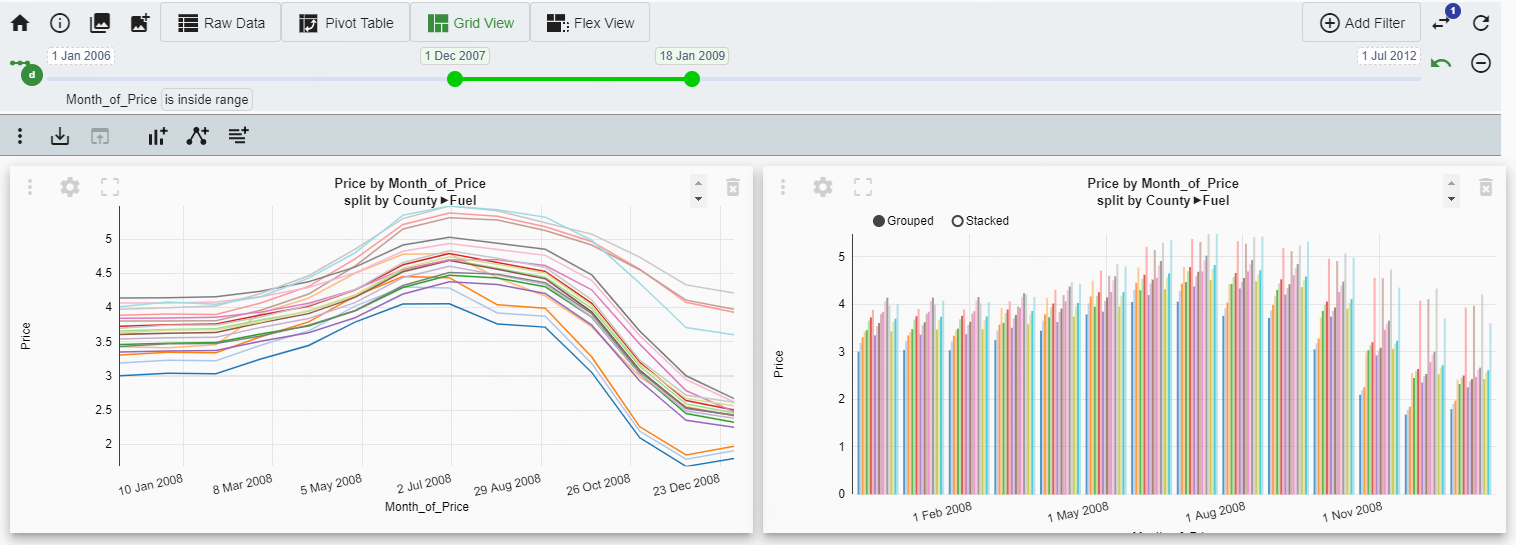
Grid and Flex View
Both of these views basically offer the same functionality. They however differ in the following points.
The Grid View contains a variable number of elements that are held in a fixed grid of customizable dimension. Individual elements may fit into a single cell or they may spread over several columns and rows, it's all up to you. When the window size changes, the element size also changes in order to always fit the allocated grid space.
The Flex View contains a variable number of elements of specific size each. When the window size changes, the size of single elements are not changed. The elements are however automatically laid out according to the available window space.
-
Element types:
-
Charts
-
Relationship Graphs
-
Summary Tables
-
Individual elements are easily customizable.
-
Raw data dialog displays contextual data upon click on element detail (i.e. chart bar, table cell).
-
Storing current view and restoring it at any time later.
-
Saving of charts and graphs to files in PNG format.
-
Saving of summary tables to files in CSV, Excel or JSON format.
There’s still much to say about Koia.io but many of its benefits only become apparent during its use. So, just get started and explore for yourself what Koia.io has to offer when working with your own data.